Heart Failure
Created March 2024
The goal of this tutorial is to learn how to simulate different types of heart failure using the CircAdapt framework. This tutorial assumes basic knowledge on Python and the VanOsta2024 model as provided in the previous tutorial named ‘Basics to Python and CircAdapt’.
This tutorial assumes the installation is followed as described on the CircAdapt framework webstite (https://framework.circadapt.org/latest/userguide/installation.html). This uses Python >3.9 installed with anaconda and editted in Spyder. Other ways are possible, but might not be in line with this tutorial.
Content
1. Healthy reference
2. Heart failure with reduced ejection fraction (HFrEF)
3. Heart failure with preserved ejection fraction (HFpEF)
First, we import all needed modules according to convention at the start of the script. We will define the VanOsta2024 model and run this model.
import circadapt
import matplotlib.pyplot as plt
import numpy as np

from circadapt import VanOsta2024
model = VanOsta2024()

model.run(stable = True)
Plot healthy reference hemodynamics
Now we obtain our hemodynamic signals and plot them for the healthy reference simulation.
# get all pressure signals
pressures = model['Cavity']['p'][:, ['cLv', 'La', 'SyArt']]*7.5e-3
p_lv, p_la, p_ao = pressures.T

# get LV and LA volume
volumes = model['Cavity']['V'][:, ['cLv', 'La']]*1e6
V_lv, V_la = volumes.T

# get time
time = model['Solver']['t']*1e3
# Plot hemodynamics

fig = plt.figure(1, figsize=(12, 4))
ax1 = fig.add_subplot(1, 3, 1)
ax2 = fig.add_subplot(1, 3, 2)
ax3 = fig.add_subplot(1, 3, 3)

# Plot pressures
ax1.plot(time, p_lv, color = 'lightgrey', linestyle = '-', label = 'left ventricle')
ax1.plot(time, p_la, color = 'lightgrey', linestyle = '--', label = 'left atrium')
ax1.plot(time, p_ao, color = 'lightgrey', linestyle = ':', label = 'aorta')
ax1.legend()

# Plot volumes
ax2.plot(time, V_lv, color = 'lightgrey', linestyle = '-', label = 'left ventricle')
ax2.plot(time, V_la, color = 'lightgrey', linestyle = '--', label = 'left atrium')
ax2.legend()

# Plot PV loops
ax3.plot(V_lv, p_lv, color = 'lightgrey', linestyle = '-', label = 'reference')
ax3.legend()

# plot design, add labels
for ax in [ax1, ax2, ax3]:
    ax.spines[['right', 'top']].set_visible(False)
ax1.set_xlabel('Time [ms]', fontsize=12)
ax2.set_xlabel('Time [ms]', fontsize=12)
ax3.set_xlabel('Volume [mL]', fontsize=12)

ax1.set_ylabel('Pressure [mmHg]', fontsize=12)
ax2.set_ylabel('Volume [mL]', fontsize=12)
ax3.set_ylabel('Pressure [mmHg]', fontsize=12)

ax1.set_title('Pressures',
             fontsize=12, fontweight='bold')
ax2.set_title('Volumes',
             fontsize=12, fontweight='bold')
ax3.set_title('Left ventricular PV loops',
             fontsize=12, fontweight='bold')

fig.suptitle('Simulating global hemodynamics ',
             fontsize=15, fontweight='bold')

plt.tight_layout()
fig

Reduced Contractility
We reduce the contractile function of the left ventricle and intraventricular septum by 40%.
# get reference sfact values for the left ventricle and intraventricular septum
model = VanOsta2024()

sfact_lv = model['Patch']['Sf_act']['pLv0']
sfact_sv = model['Patch']['Sf_act']['pSv0']

# reduce the value for sfact to 60% of its inital value
model['Patch']['Sf_act']['pLv0'] = 0.6*sfact_lv
model['Patch']['Sf_act']['pSv0'] = 0.6*sfact_sv

print('The new sfact for the LV and SV equal ', model['Patch']['Sf_act']['pLv0']*1e3, ' kPa and ', 1e3*model['Patch']['Sf_act']['pSv0'], ' kPa respectively.')

# run the model
model.run(stable = True)
The new sfact for the LV and SV equal 72000000.0 kPa and 72000000.0 kPa respectively.
# obtain hemodynamics

# get all pressure signals
pressures = model['Cavity']['p'][:, ['cLv', 'La', 'SyArt']]*7.5e-3
p_lv, p_la, p_ao = pressures.T

# get LV and LA volume
volumes = model['Cavity']['V'][:, ['cLv', 'La']]*1e6
V_lv, V_la = volumes.T

# get time
time = model['Solver']['t']*1e3
# plot hemodynamics

# Plot pressures
ax1.plot(time, p_lv, color = 'darkred', linestyle = '-', label = 'left ventricle')
ax1.plot(time, p_la, color = 'darkred', linestyle = '--', label = 'left atrium')
ax1.plot(time, p_ao, color = 'darkred', linestyle = ':', label = 'aorta')

# Plot volumes
ax2.plot(time, V_lv, color = 'darkred', linestyle = '-', label = 'left ventricle')
ax2.plot(time, V_la, color = 'darkred', linestyle = '--', label = 'left atrium')

# Plot PV loops
ax3.plot(V_lv, p_lv, color = 'darkred', linestyle = '-', label = 'reduced contractility')
ax3.legend()

fig
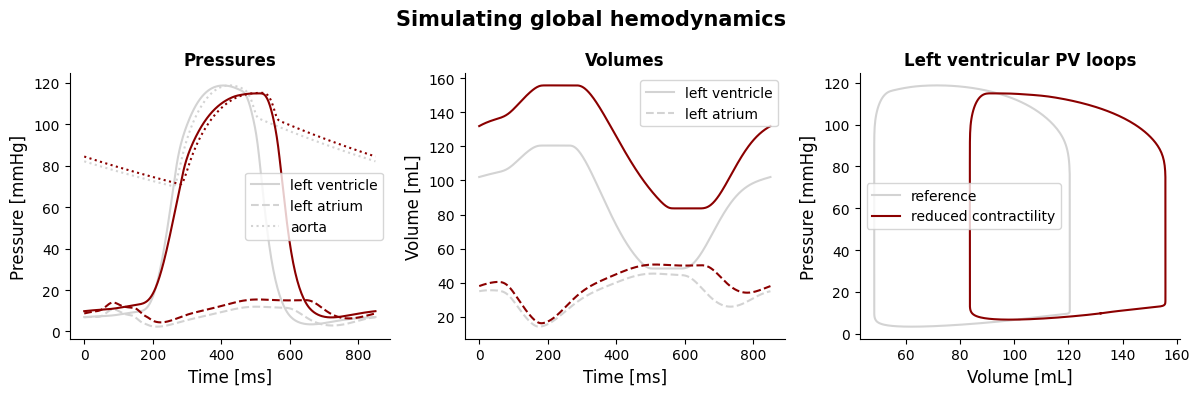
It can be seen that for HFrEF, the LV is dilated and that the EF is reduced.
Increased ventricular stiffness
We can simulate an increased passive stress (thereby increasing the myocardial stiffness). In this tutorial, we will increase the myocardial stiffness by 70% (model parameter k1).
# get reference values for stiffness  (these are equal for the LV and intraventricular septum)

model = VanOsta2024()

# set parameters for the LV and septum
model['Patch']['k1'][['pLv0', 'pSv0']] *= 1.7     # increase of 70%

print('The new k1 and td for the LV and SV equal ', model['Patch']['k1']['pLv0'], ' [-].')

# run the model
model.run(stable = True)
The new k1 and td for the LV and SV equal 17.0 [-].
# obtain hemodynamics

# get all pressure signals
pressures = model['Cavity']['p'][:, ['cLv', 'La', 'SyArt']]*7.5e-3
p_lv, p_la, p_ao = pressures.T

# get LV and LA volume
volumes = model['Cavity']['V'][:, ['cLv', 'La']]*1e6
V_lv, V_la = volumes.T

# get time
time = model['Solver']['t']*1e3
# plot hemodynamics
fig = plt.figure()
ax1 = fig.add_subplot(1, 3, 1)
ax2 = fig.add_subplot(1, 3, 2)
ax3 = fig.add_subplot(1, 3, 3)
# Plot pressures
ax1.plot(time, p_lv, color = 'darkblue', linestyle = '-', label = 'left ventricle')
ax1.plot(time, p_la, color = 'darkblue', linestyle = '--', label = 'left atrium')
ax1.plot(time, p_ao, color = 'darkblue', linestyle = ':', label = 'aorta')

# Plot volumes
ax2.plot(time, V_lv, color = 'darkblue', linestyle = '-', label = 'left ventricle')
ax2.plot(time, V_la, color = 'darkblue', linestyle = '--', label = 'left atrium')

# Plot PV loops
ax3.plot(V_lv, p_lv, color = 'darkblue', linestyle = '-', label = 'Increased Stiffness')
ax3.legend()

plt.show()
fig
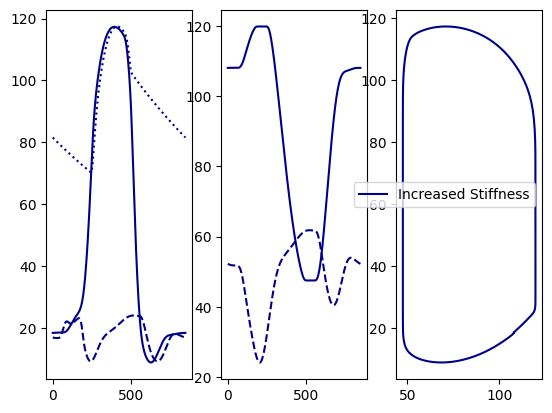
It can be seen that the left ventricular end-diastolic pressure is increased, while no left ventricular dilatation occurs and ejection is preserved.