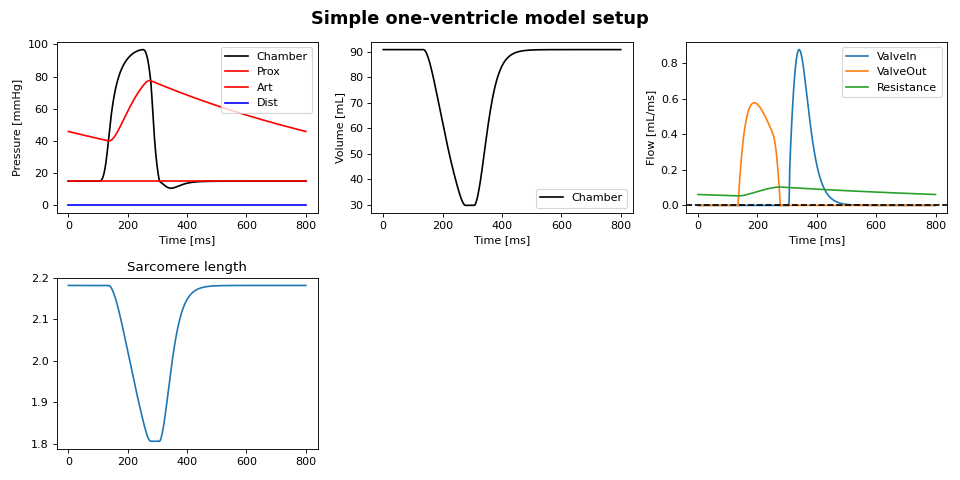
Simple One-Ventricle Open Circulation
Todo
Make One-Ventricle Circulation figure
(Source code, png, hires.png, pdf)

The full code to generate this plot is shown below.
  1# -*- coding: utf-8 -*-
  2import sys
  3import os
  4# sys.path.append('../../../src/')
  5
  6import circadapt
  7import circadapt.model
  8import circadapt.model.vanosta2023
  9
 10import circadapt.plot
 11
 12# Uncomment next lines if not installed
 13# circadapt.DEFAULT_PATH_TO_CIRCADAPT = os.getcwd() + "../../../../../CircAdapt_Library/out/build/x64-Release/CircAdaptLib.dll"
 14
 15
 16import circadapt
 17
 18import addcopyfighandler
 19import matplotlib
 20matplotlib.rcParams['savefig.format'] = 'svg'
 21
 22import numpy as np
 23import matplotlib.pyplot as plt
 24
 25import time
 26
 27def create_model():
 28    ###
 29    n_beat = 1
 30
 31    dt = 0.001
 32    solver = "forward_euler"
 33
 34    # open model
 35    model = circadapt.CircAdapt(solver)
 36
 37    model['Solver']['dt'] = dt
 38    model['Solver']['dt_export'] = dt
 39
 40    # Add modules to the wrapper
 41    model.add('Chamber')
 42    model.add('Patch')
 43    model.add('NodePressure')
 44    model.add('Capacitor')
 45    model.add('Resistance')
 46    model.add('Diode')
 47
 48    # Build the cavity C using a Chamber2022 object. This object automatically
 49    # gets an Wall object with no patches, so a patch must be added.
 50    model['Chamber'].add('C')
 51    model['Patch'].add('C.wC.P')
 52
 53    # add windkessel
 54    model['NodePressure'].add('Prox')
 55    model['NodePressure'].add('Dist')
 56    model['Capacitor'].add('Art')
 57    model['Resistance'].add('Resistance', prox='Art', dist='Dist')
 58    model['Diode'].add('ValveIn', prox='Prox', dist='C')
 59    model['Diode'].add('ValveOut', prox='C', dist='Art')
 60
 61    # parameters
 62    # model.set('Model.Valve.R', 10)
 63    model.set('Model.ValveIn.R', 10e5)
 64    model.set('Model.ValveOut.R', 1e7)
 65    model.set('Model.Resistance.R', 1e8)
 66    model.set('Model.Art.C', 1e-8)
 67
 68    # set proximal pressure
 69    model.set('Model.Prox.Pressure.set_time', 0)
 70    model.set('Model.Prox.Pressure.set_value', 2000)
 71
 72    # set state variables
 73    model.set('Model.C.V', 10e-6)
 74    # model.set('Model.SyArt.V',   200e-6)
 75    # model.set('Model.SyVen.V',   300e-6)
 76
 77    # parameterize patch
 78    model['Patch']['dt'] = 0.1
 79    model['Patch']['Sf_act'] = 100e3
 80    model['Patch']['Sf_pas'] = 1e3
 81    model['Patch']['Am_ref'] = 0.011
 82    model['Patch']['k1'] = 10
 83    model['Patch']['v_max'] = 7
 84    model['Patch']['V_wall'] = 1e-04
 85    model['Patch']['tr'] = 0.25
 86    model['Patch']['td'] = 0.25
 87    model['Patch']['time_act'] =  0.2
 88    model.set('Model.C.wC.P.l_si', 2.0)
 89    model.set('Model.Art.V', 10e-4)
 90    model.set('Model.Art.V0', 1e-4)
 91    # model.set('Model.Art.C', 2e-8)
 92    # model.set('Model.Art.V', 200)
 93
 94
 95    # model['Tube0D']['p0'][0] = 900
 96    # model['Tube0D']['A0'][0] = 6e-4
 97
 98    # Run beats
 99    # t0 = time.time()
100    # model.run(n_beat)
101    # print(time.time()-t0)
102
103    return model
104
105# %% Run model and plot
106if __name__ == '__main__':
107    model = create_model()
108    model.set('t_cycle', 0.8)
109    model.run(15)
110
111
112# %%
113    plt.figure(1, clear=True, figsize=(12, 6))
114    t = model['Solver']['t'] * 1e3
115
116    m=2
117    n=3
118
119    ax = plt.subplot(m,n,1)
120    ax.plot(t, model.get('Model.C.p')/133, label='Chamber', color='k')
121    ax.plot(t, model.get('Model.Prox.p')/133, label='Prox', color='r')
122    ax.plot(t, model.get('Model.Art.p')/133, label='Art', color='r')
123    ax.plot(t, model.get('Model.Dist.p')/133, label='Dist', color='b')
124    plt.legend()
125    ax.set_ylabel('Pressure [mmHg]')
126    ax.set_xlabel('Time [ms]')
127
128    ax = plt.subplot(m,n,2)
129    ax.plot(t, model.get('Model.C.V')*1e6, label='Chamber', color='k')
130    ax.set_ylabel('Volume [mL]')
131    ax.set_xlabel('Time [ms]')
132    plt.legend()
133
134    ax = plt.subplot(m,n,3)
135    ax.plot(t, model.get('Model.ValveIn.q')*1e3, label='ValveIn')
136    ax.plot(t, model.get('Model.ValveOut.q')*1e3, label='ValveOut')
137    ax.plot(t, model.get('Model.Resistance.q')*1e3, label='Resistance')
138    plt.legend()
139    ax.axhline(0, color='k', linestyle='--')
140    ax.set_ylabel('Flow [mL/ms]')
141    ax.set_xlabel('Time [ms]')
142    plt.legend()
143
144
145    ax = plt.subplot(m,n,4)
146    ax.plot(t, model['Patch']['l_s'], label='ValveIn')
147    ax.set_title('Sarcomere length')
148
149    plt.suptitle('Simple one-ventricle model setup', fontsize=16, weight='bold')
150
151
152    # ax = plt.subplot(m,n,4)
153    # ax.axhline(0, color='k', linestyle='--', lw=1)
154    # ax.set_ylabel('C')
155    # plt.legend()
156
157    plt.tight_layout()
158    plt.draw()
159    plt.show()